The dashboard says 380 sales.
The ad bill says OMR 1,440.
The owner asks a harder question.
Picture a perfume and oud shop in Muscat with a loyal customer base. Every month it retargets past customers on Instagram and sends offers to its WhatsApp list. Ads Manager credits the campaign with 380 purchases from OMR 1,440 of spend: under OMR 4 per sale. On paper, it is the best campaign the business runs.
Then the owner notices something uncomfortable. Many of those “ad-driven” buyers are the same regulars who visit before every Eid, every National Day and every wedding season. Would they have bought anyway?
This is a fictional teaching example, not a client case study or an Oman benchmark. We will use it to run the simplest experiment that answers the owner’s question: hold some customers back, then compare.
Your ad report measures contact, not cause
Ad platforms credit a campaign when someone who saw or clicked an ad converts within the attribution window. That is useful for steering campaigns. It does not prove the ad changed anyone’s mind.
The gap is widest where ads reach people who were already close to buying: past customers, recent website visitors and people searching for your brand name. Those audiences buy at high rates with or without advertising, so almost any campaign aimed at them looks brilliant.
eBay tested this at scale. In a series of large field experiments, its researchers found that the returns from paid search were a fraction of conventional non-experimental estimates, and that brand-keyword ads had no measurable short-term benefit for eBay. [1]
eBay is one of the most recognised names on the internet, and your business is not eBay. A growing Muscat brand may genuinely need its brand ads, for example when competitors bid on its name. The lesson is not “switch off brand and retargeting.” It is “stop assuming, and test.”
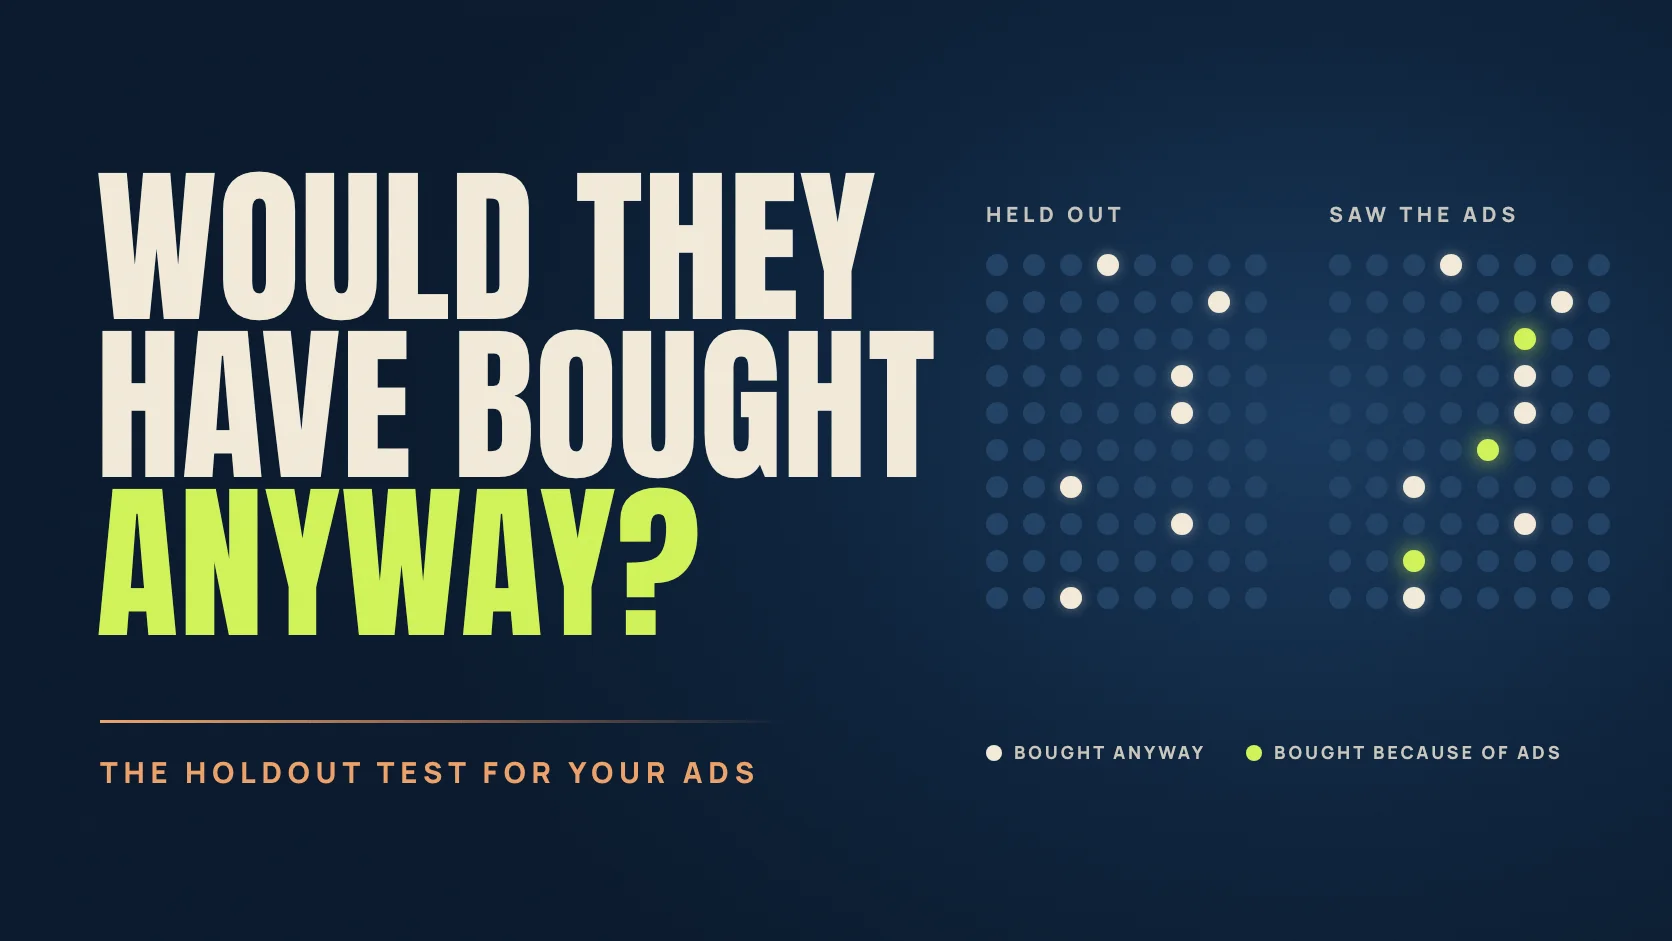
Because chance decided who was held out, the holdout’s 2.5% buying rate shows what the targeted group would probably have done without the campaign. Only the difference, 0.9 percentage points, belongs to the ads.
Set up a holdout in one afternoon
A holdout test is a controlled comparison. You randomly keep a group of people away from a campaign, run the campaign to everyone else, and compare what the two groups do over the same period.
A customer list is the easiest place to start. You already know who these people are, and you can see their purchases in your own records rather than relying on what an ad platform can observe.
- Write one question. “Does our monthly retargeting and WhatsApp offer create extra buyers among past customers?” One campaign, one audience, one outcome.
- Export a clean list. Use customers you are permitted to market to, with a customer ID or phone number that also appears in your sales records. Remove anyone who has opted out. The Oman data privacy guide for marketers covers consent in more detail.
- Split at random before launch. In a spreadsheet, add a column with
=RAND(), sort by it and mark the first 20% as the holdout. Never hand-pick. If your best customers cluster in one group, the test is broken before it begins. - Keep the holdout clean. Upload only the targeted group to your custom audiences and broadcast lists, and exclude the holdout wherever your platforms allow. Check that the campaign cannot reach the holdout through a broader audience, such as all website visitors. Organic posts can continue for everyone.
- Count buyers in your own records. Match purchases from the shop, website and WhatsApp orders back to both groups by customer ID or phone number. Count each person once: bought or did not buy. Your till sees sales the ad platform never will.
- Fix the rules in advance. Decide the duration, the measure and the decision rule before launch. Run at least one normal buying cycle and do not stop early because the first week looks exciting.
- Question
- Does the win-back campaign create extra buyers?
- Audience
- 20,000 customers who bought in the last 18 months and agreed to marketing
- Split
- 80% targeted · 20% held out · random, fixed before launch
- Duration
- Four weeks. Note any holidays in the window, because peak-season results may not repeat in a quiet month.
- Measure
- Share of each group that bought, from our own sales records
- Decision
- Keep the campaign if extra contribution beats spend. Retest if the result is too close to call.
Read the result like an owner
After four weeks, the fictional shop checks its sales records. In the targeted group, 544 of 16,000 customers bought: 3.4%. In the holdout, 100 of 4,000 bought: 2.5%. To keep the arithmetic simple, each buyer made one purchase during the test.
Without the campaign, the targeted group would probably have bought at the holdout’s rate: 16,000 × 2.5% = 400 buyers. It actually produced 544. The difference, 144 extra buyers, is the estimate of what the campaign caused.
| Measure | Platform report | Holdout test |
|---|---|---|
| Sales credited to the campaign | 380 | 144 extra |
| Ad cost per sale | OMR 3.79 | OMR 10.00 |
| Contribution after ad spend | OMR 3,880 | OMR 576 |
The campaign works. It is simply less spectacular than the report suggested: about OMR 10 per extra buyer, not OMR 3.79. With OMR 14 contribution per purchase before advertising, 144 extra buyers produce OMR 2,016 and leave OMR 576 after the ad spend.
The platform was not lying. It was answering a different question. Many of the 380 purchases it credited came from regulars who were going to buy during those four weeks anyway; the campaign simply reached them first.
Is 144 real, or luck?
Two random groups never behave identically, even with no campaign at all. So treat 144 as an estimate with a range. For these group sizes, a rough 95% range runs from about 54 to 234 extra buyers. The range does not include zero, so the lift is unlikely to be pure chance.
The break-even point, however, sits inside that range. OMR 1,440 ÷ OMR 14 means the campaign needs 103 extra buyers to pay for itself. At the low end it loses money; at the high end it earns well. The honest conclusion: the campaign creates real extra sales, and it is probably, but not provably, profitable. The next test could use a larger holdout, or lower the spend to see whether most of the lift survives.
Did the campaign create extra sales?
Use results from a randomised holdout. Count buyers in each group from your own sales records over the same period, and enter contribution per buyer before advertising.
Likely real: the rough 95% range for extra buyers (54 to 234) excludes zero. You need 103 extra buyers to cover the spend, and that sits inside the range, so profitability is not yet certain.
Calculations run in your browser. This calculator does not send or save your inputs. The range is a rough normal approximation for randomised groups and becomes unreliable when either group has fewer than about 10 buyers. For high-stakes decisions, ask an analyst to review the design.
When a customer-list holdout is not possible
A customer-list holdout only covers people you can identify. Prospecting campaigns, search ads and broad video need other designs, each with its own trade-offs.
Platform lift studies
Google Ads Conversion Lift compares people who see your ads with a control group who do not, using user-based or geography-based groups; it is not available to every account, so ask your Google representative. [2] Meta’s Conversion Lift also compares a group that sees your ads with one that does not. [3]
Geography tests
Pause or change a campaign in some areas and keep it running in comparable others. In Oman, Muscat dominates many accounts, so genuinely comparable areas can be hard to find. Treat the result as directional unless the design is strong.
On/off tests
Switching a campaign off for a few weeks is cheap but fragile. Salary days, Ramadan, Eid, National Day and school holidays can move demand more than your ads do. Compare with the same period in earlier years and keep careful notes.
Marketing mix models
With years of consistent spend and sales data across channels, a marketing mix model estimates each channel’s contribution. Google’s open-source Meridian can use experiment results to inform the model. [5]
Platform experiments have become more accessible. Google reported lowering the minimum budget for its incrementality experiments to about USD 5,000, down from roughly USD 100,000. [4] For many Oman businesses that is still meaningful money. A customer-list holdout costs nothing extra except the discipline to run it properly.
Which campaigns deserve a holdout first?
Start where the gap between reported and real performance is likely to be widest: anywhere the campaign mainly reaches people who already know you.
| Campaign | Why it may over-claim | A sensible first test |
|---|---|---|
| Retargeting past customers | It targets people who are already likely to buy. | Customer-list holdout of 10–20% |
| WhatsApp and email offers | Loyal customers often buy during a campaign anyway. | Withhold the broadcast from a random part of the list |
| Brand search | People searching your name were already looking for you. | A carefully timed pause, watching competitors in Auction insights |
| Performance Max | It can mix new prospects, brand searches and returning visitors. | A platform lift study or a geography test |
| Public discount codes | Codes that spread online get used by people who would have paid full price. | Compare buyers who received the code with a random group who did not |
Before you call a campaign a winner
Ask a better question at the next review
Replace “What was our ROAS?” with “What would have happened without this campaign, and how do we know?”
Sometimes the answer is uncomfortable: a favourite campaign mostly harvests sales that were already coming. More often it is useful: the campaign works, but at a different price from the one on the dashboard, and that tells you how much it deserves. If you are planning bigger budgets for National Day, year-end or Ramadan 2027, run a holdout now, while the stakes are lower. For the earlier question of whether your enquiries are the right ones, read why leads do not become sales.
Questions before you hold anyone out
Am I losing sales by holding customers back?
If the campaign works, the holdout will buy slightly less during the test. That is the price of knowing. A modest, time-limited, random holdout, often 10–20%, usually costs far less than a year of spending on a guess.
How big should the holdout be?
It depends on how often your customers buy and how large a difference you expect. Rare purchases and small effects need bigger groups or longer tests. If the calculator’s range includes zero, the test was too small or too short to answer the question, or the effect is genuinely small.
Does this replace my ad platform reports?
No. Platform reports remain useful for day-to-day optimisation. A holdout test calibrates them: it shows how much of the reported performance is truly extra, so budget decisions rest on the right numbers.
Can I test campaigns aimed at new customers?
A customer-list holdout only covers people you already know. For prospecting, use a platform lift study or a carefully designed geography test.
References & method
Sources checked September 23, 2026. Platform features and eligibility change. The perfume shop and all OMR figures are fictional and exist only to explain the method.
- Blake, Nosko and Tadelis: Consumer Heterogeneity and Paid Search Effectiveness, a Large Scale Field Experiment — NBER working paper, later published in Econometrica (2015); eBay’s brand and non-brand search experiments.
- Google Ads Help: About Conversion Lift — treatment and control groups, and account eligibility.
- Meta for Business: Conversion Lift — comparing a test group that sees ads with a control group that does not.
- PPC Land: Google lowers incrementality testing threshold to $5,000 — industry report of Google’s lower minimum budget.
- Google for Developers: Meridian — Google’s open-source marketing mix model and experiment calibration.
Method: buying rate = buyers ÷ people in the group. Extra buyers = (targeted rate − holdout rate) × people targeted. Cost per extra buyer = spend ÷ extra buyers. Contribution after spend = extra buyers × contribution per buyer − spend. The rough 95% range is extra buyers ± 1.96 × √(p₁(1 − p₁)/n₁ + p₂(1 − p₂)/n₂) × people targeted, where p is each group’s buying rate and n its size.